
(Editor’s note: This article originally appeared in the September/October 2017 issue of Roast Magazine. Photos by Rob Hoos and figures adapted from Cropster export files. Links have been added for context.)
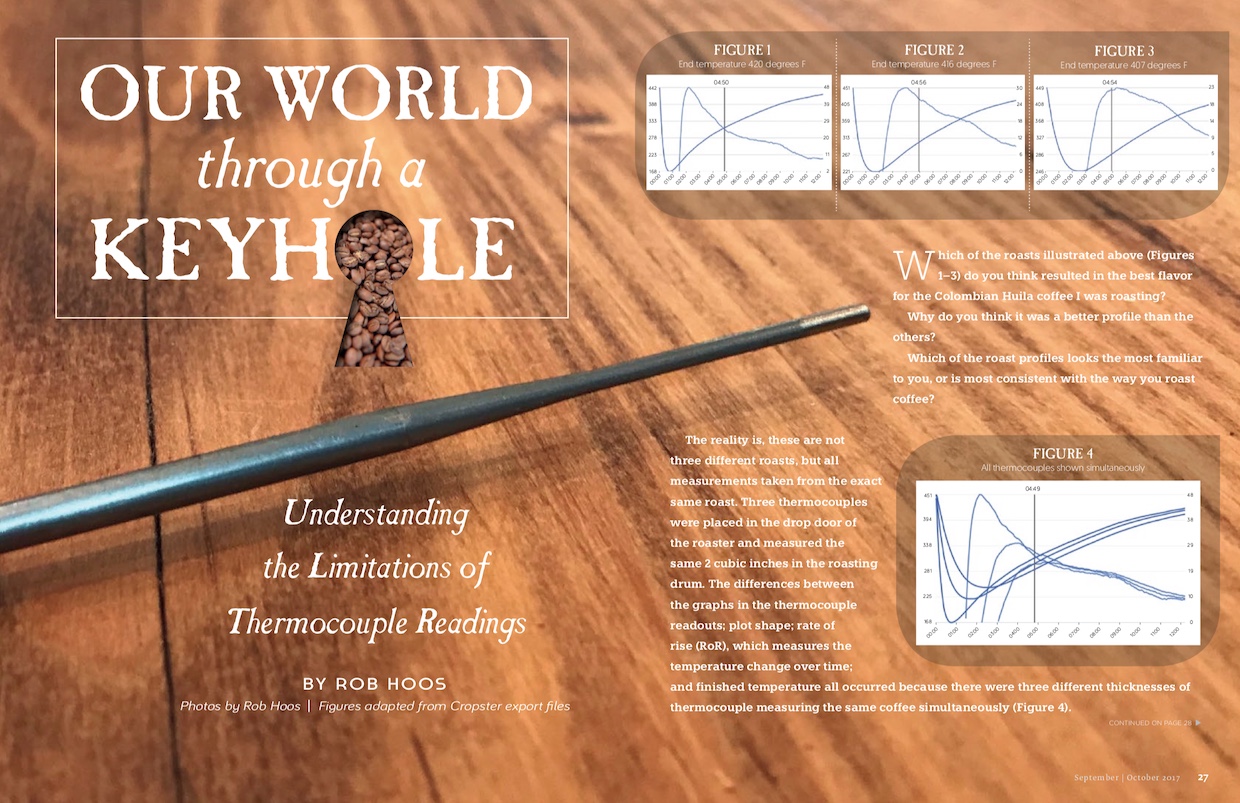
Which of the roasts illustrated in Figures 1–3 do you think resulted in the best flavor for the Colombian Huila coffee I was roasting?
Why do you think it was a better profile than the others?
Which of the roast profiles looks the most familiar to you, or is most consistent with the way you roast coffee?

The reality is, these are not three different roasts, but all measurements taken from the exact same roast. Three thermocouples were placed in the drop door of the roaster and measured the same 2 cubic inches in the roasting drum. The differences between the graphs in the thermocouple readouts; plot shape; rate of rise (RoR), which measures the temperature change over time; and finished temperature all occurred because there were three different thicknesses of thermocouple measuring the same coffee simultaneously (Figure 4).
While a thermometer uses the known expansion of a material (liquid or solid) to measure temperature based on changes in volume or size, thermocouples function differently. Simply put, a thermocouple is a temperature measurement device that uses the difference in voltage between two wires made of different types of metal. The temperature is measured at the junction of the two wires. These wires are typically sheathed in a metal coating, which varies in thickness and material. Alternately, there are resistance temperature detectors (RTDs), which base measurements on the difference in temperature by passing a low voltage current through the system and measuring the voltage drop, which has a known correlation with temperature. Frequently in our industry we inaccurately refer to any measuring device in a roaster as a thermocouple. In this article we are talking about actual thermocouples, specifically the thermocouple located in the bean pile inside the roaster.

As specialty coffee roasters, we are frequently presented with a significant problem: We are effectively unable to talk to each other about our roasting process, technique or outcomes with regard to bean temperature because the measurement of the “bean temperature” is not transferable from machine to machine. People ask me questions all the time about turnaround time and temperature, maximum/minimum RoR, end temperature, etc. However, the problem with these questions is the relative nature of bean probe thermocouples and how they relate to temperature readings.
In this article, we will review some experiments using three different roasters and varying thicknesses of thermocouples. At the end of the day, I hope to make you question your thermocouple, perhaps experience some existential crisis over the fact that we don’t really know precisely what is happening and, finally, make you feel a sense of calm as you realize our thermocouples still give us an exceptional ability to control quality and produce amazing coffee.

Three thermocouples of different thicknesses. From left: 1.6 mm, 3.2 mm and 6.4 mm.
What Are We Seeing?
I want to start by asking a seemingly simple question to help us frame the conversation: Of what exactly is the thermocouple placed in the bean pile reporting the temperature? The seemingly simple answer is, “The mass of beans rolling around in the roaster.” However, this answer is incorrect. The truth is, the thermocouple is reporting its own temperature, specifically at and near the tip of said thermocouple.
What, then, is influencing the temperature of the thermocouple?
That’s complicated, because the thermocouple is affected by sheath thickness, probe placement relative to the roaster design, probe placement relative to the bean pile, the bean mass, the airflow filtering through the bean mass, air velocity and burner adjustments. We must constantly remind ourselves that the actions of a thin (1.6-mm [1/16-inch], 3.2-mm [1/8-inch] or 6.4-mm [1/4-inch]) piece of metal jammed inside a metal machine — with hot airflow filtering through the coffee beans and radiative heat, and filled with organic material — are not going to report with 100 percent accuracy the temperature of that organic material’s surface, let alone its inner core. We should instead be content to discuss the measurement of bean temperature through a thermocouple buried in the bean mass inside the roaster as being a proxy for the theoretical bean mass temperature. Perhaps it is best to call the “bean” temperature thermocouple the “process” temperature thermocouple instead. (In light of this, we will refer to it as the process temperature thermocouple from here forward.)

Experiments in Thermocouple Readings
Now let’s begin to delve into the causes behind temperature readouts on the process temperature thermocouple when it comes to roasting coffee, and how these might influence our understanding of the data we receive during the coffee roasting process.
The first variable worth considering is the thickness or size of the sheath on the thermocouple. The key consideration here is responsiveness. Typically speaking, thinner thermocouples are more responsive to temperature changes, whereas thicker thermocouples have greater thermal inertia and tend to respond more slowly. This is not only true in coffee and coffee roasting; it is true throughout the temperature measurement industry.
As another example, Figure 5 shows three common thicknesses of thermocouple moving from boiling water to ambient air temperature. As you can see in the diagram, there are significant differences in the rate of cooling between the three thermocouples. The 1.6-mm thermocouple cools the quickest, with the 3.2-mm thermocouple close on its tail. The thickest thermocouple (6.4 mm) is remarkably slow to return to room temperature, and after nearly 10 minutes still registers 10 degrees F higher than the other two.

Turnaround Time/Temperature as a Function of Response Time
One of the first places we see the response time causing a significant difference is in the turnaround time and temperature. Turnaround is how we describe the thermal equilibrium between the thermocouple and the bean mass at the beginning of the roast. In most roasting systems, there is a requirement to preheat the metal and the air circulating through the machine in order to build a thermal capacitance or charge to help the roast move through the earliest stage, where the steepest RoR is required. Therefore, the thermocouples are heated significantly as the roaster is preheated.
When the beans are dropped in at room temperature, this causes the thermocouples to cool quickly as the beans are being heated rapidly due to the thermal gradient (the differences in temperature across the substances in the roasting drum). Where the thermocouple reaches a zero-degree-per-minute RoR, we have a theoretical thermal equilibrium between the bean mass and the thermocouple. This is the moment we refer to as turnaround.
Turnaround, then, is simply a function of the thermal charge of the roaster, the thermal mass of the coffee beans and the responsiveness of the thermocouple. For the roast pictured in Figures 1–4, we saw three remarkably different turnarounds for the same roast. (See Figure 6 for a closer look at the turnaround points.) The thinnest thermocouple (1.6 mm) experienced turnaround in 47 seconds, the 3.2-mm in one minute 43 seconds, and the 6.4-mm in two minutes 46 seconds. Effectively, there was a one-minute difference between each of the thermocouples. Note that this does not mean the coffee experienced anything different, merely that the temperature reading device was different and thus gave different results.
The Spread During and at the End of the Roast
We also see this difference in thermocouple response time during the roast and with the final temperature. Some may presume the thermocouples should increase in alignment as time progresses, and eventually should all report the same temperature. This is not the case, however, as we are constantly adding heat energy into the system, and the thermocouples are constantly reading slightly differently as the actual temperature (and the point at which they would all eventually reach equilibrium) is constantly climbing. Had we plateaued the heat application entirely, we could expect them eventually to align, but the roasting process is one in which we are fairly constantly applying some heat and experiencing an RoR greater than zero degrees per minute. Therefore, the thicker thermocouples will always be in a state of lag compared to the thinner thermocouples.

What Does Response Time Mean for Roasters?
This leads us to the question: Which thermocouple’s response time is most in line with that of the bean mass? I wouldn’t say it’s impossible to know the exact response rate of the bean mass. Scientifically, we could figure it out (as some researchers have) by implanting a thermocouple inside a bean and holding another thermocouple on the surface of the bean to monitor the temperature gradient and the bean temperature. But this is not practical for the production roaster.
The challenge in figuring out a “most accurate” response time is that the rate of heat energy absorption of the bean changes, and the chemical and physical properties of the bean change — along with the fact that beans of different sizes, moisture content, water activity, densities and cultivars likely will react slightly differently. As the coffee dries out, as it loses density, as it goes through the glassy transition, all of these reactions cause changes to the rate of energy absorption. Therefore, it is likely that no single thermocouple will give us a perfect view of the bean’s temperature, or even the direct effect on the bean pile of changes we make during roasting.
That being said, thermocouples are wonderful proxies that help us understand the inner workings of the roasting mass better than we ever would without them. Additionally, the process temperature thermocouple is an amazing tool for consistency. Not that it will necessarily be consistent from machine to machine, but within the individual machine it gives us the ability to fairly closely replicate roasts. I could give you example after example of a coffee having a similar roasted color (whole-bean and ground, within 1 to 2 points on the ColorTrack and Agtron scales), where the roast was ended using only the bean temperature thermocouple to determine the endpoint and drop time into the cooling tray.
Another important consideration is that thicker thermocouples tend to naturally filter the data, or smooth the line, because they are not able to react as quickly. This can make it look like the curve being graphed (or the coffee being roasted) is progressing more desirably, but it is really just a smoothing function of the thermal lag (the delay in response time). Though durable, they can sometimes be too slow to react and may not give an accurate enough indication of what is happening in the drum. Sometimes this can lead to accidental variations in roast that you can taste on the cupping table but not see on the data logger.

Loring’s new miniature demonstration roaster in the testing bay at Loring Smart Roast in Santa Rosa, California. Here you can see the return air and bean probe thermocouples.
Bean Temperature and Rate of Rise (RoR)
Another question is, how does this theoretical difference between the response rate of the bean mass and the response rate of the thermocouple affect our understanding of RoR measurements?
If we’re not exclusively reading the bean temperature, and if the response time of the process temperature thermocouple is different from that of the bean mass, what can we understand from RoR measurements and how can these help us?
Paying attention to RoR is helpful in modern roasting, in that it acts as a leading indicator of the bean mass temperature and helps greatly in our quest for consistency. It isn’t wrong that roasters are looking at it with a new enthusiasm and interest. In fact, I wish roasters would pay more attention to the temperature of the air entering the roasting drum, then RoR, then process temperature when it comes to monitoring heat transfer for efficiency and consistency.
That being said, I believe it is important to consider carefully what RoR is telling us. As stated previously, a thermocouple tells us its own temperature, not necessarily the temperature of the substance it is immersed in. Likewise, RoR for the process temperature thermocouple is not showing us the rate of change of the bean mass per se, but rather the rate of change of the thermocouple stuck within the bean mass, as affected by its response time. Whether at any given point the beans are absorbing heat more quickly or slowly than the thermocouple is up for debate and needs to be seriously investigated in future scientific studies; however, we should not assume they are the same, merely that the process thermocouple’s RoR is a proxy for that of the actual bean mass.
Figures 7, 8 and 9 show multiple thermocouples on three different machines during three different roasts. Specifically, let’s look at the end of the roast, where I believe you’ll agree we see some interesting results.
I want to draw your attention to the various shapes the RoR curve can take during the same roast. In all the roasts, we see the 1.6-mm thermocouple react strongly to the burner adjustment around first crack. It even shows an interesting phenomenon where it dips and then comes back up in terms of the RoR. Meanwhile, the thicker thermocouples do not experience this in the same way. They experience a constant decline (with the exception of the US Roaster Corp roast, in which the 3.2-mm thermocouple rises 0.4 degrees F from its bottom-out point to the end of the roast).
Theoretically, the temperature of the thinner thermocouple is likely somewhat higher than the actual bean temperature, and thus decreases with the removal of heat application back toward the actual bean temperature, and begins to rise with it after the fact. Once again, this illustrates that thermocouple measurements are completely dependent on the probe you’re using to measure. It also draws into question, with such a variety of slightly different-sized pieces of metal, how different is the actual bean mass compared to what we’re measuring?
I would also like us to consider this in terms of defining or prescribing a maximum RoR at the beginning of the roast to avoid defect, and a minimum RoR at the end of the roast to avoid what many refer to as “stalling” or “baking.” Because thermocouples are so different, they demand us to have different expectations in terms of both a maximum and minimum RoR, which are dependent on machine, probe placement and probe thickness.

Thermocouple Placement
Another cause of measurement differences is the placement of the thermocouple, which affects the amount of exposure to airflow and radiant energy, among other things — and these differences can be amplified depending on batch size. Table 1 illustrates the effect of thermocouple placement within the roaster.
Note that the 6.4-mm thermocouple placed in a different location gives us an even less responsive reading regarding changes in the bean mass. As we near the end of the roast, we see that the variance between the different placements is increasingly expansive. To show how dissimilar these measurements can be, let’s look at the widest possible range side by side. Figure 10 shows a roast of a Kenyan coffee with a 1.6-mm probe located in the drop door and a 6.4-mm probe located to the top left of the drop door.
Similarly, Figure 11 shows a roast profile match done on two different roasters, a Probatino and a Loring, in which the same basic profile was completed to the same whole-bean and ground end colors (Probatino 60 WB, 55 GR; Loring 61 WB, 54.54 GR according to the ColorTrack bench model | Probatino 68 WB, 93 GR; Loring 68 WB, 92 GR, according to Javalytics using the Agtron Gourmet Scale).
For both roasts, the coffee entered yellow, brown and first crack at the same time. The Probatino’s thermocouple was placed in the faceplate above the door and was thicker than the thermocouple placed inside the Loring’s drop door. In both of these instances, we see the potential for the wide distribution of thermocouple readings based on thickness and placement. It makes me wonder how much “different-looking” profiles can be attributed merely to different thermocouple types, thicknesses and placement, and have little to nothing to do with the way the roaster applies heat to the coffee.

The Take Away
After completing the tests detailed in this article, I believe we can make the following conclusions about thermocouples and how to use them most effectively:
Consider moving to a thinner thermocouple placed lower in the drum (in the drop door). The Loring we use at Nossa Familia Coffee was the sixth machine built by Loring. When we started roasting on it, the process temperature thermocouple was near the top left of the drop door and was 6.4 mm thick. We roasted on that machine in that configuration for quite some time. We noticed that, occasionally, the profile would be bang on but the coffee would taste a little baked. We chalked it up to one of those things in coffee roasting that makes no sense, and we just kept up on our production cupping to do pass/fail on the beans before sending them out.
When we upgraded to Loring’s current configuration (the 1.6-mm thermocouple in the drop door), we ran both for a while. Though we were still using the 6.4-mm as our control, we were watching the 1.6-mm thermocouple to learn how it was different and become acclimated to it before fully switching over. What we began to see helped us make sense of what was happening with those “off” batches. Though the thick thermocouple was smack on profile, the thinner thermocouple actually showed us going into negative RoR. We had been losing energy post first crack and “baking” the coffee without realizing it. For us, moving to that thinner thermocouple in the drop door made a huge difference in quality control.
Please note that making this change will make it necessary to rework your profiles either slightly or entirely.

A US Roaster Corp 3-kilo roaster running with 1.6-mm and 3.2-mm thermocouples in the faceplate.
Remember that thermocouple measurements are relative and only a proxy for the actual bean temperature. There are rarely easy answers in life, and coffee roasting is no exception. One cannot simply look at a computer-charted roast profile and say whether a coffee is good or bad, whether it passes or fails. You can get a lot of information from the profile, and if it is annotated with color changes, events, control changes, weight loss and end color (whole-bean and ground), you may even come close to understanding what happened during the roast, but it isn’t perfect. For example, it is possible to have an RoR that is negative while the roast is still progressively getting darker and continuing to crack vigorously. (This happens by pushing the roast hard until right before first crack, then dropping off the burner. The RoR plummets, but the beans continue darkening and cracking vigorously. Then you can end the roast before the beans actually end their forward momentum.) This isn’t common practice, nor am I saying roasters should aim to do this — I’m merely suggesting that the trajectory the beans travel during roasting is far more complex than a graph will make it out to be.
If you want to aim for a certain shape of profile or a certain goal with your RoR, that’s awesome; however, I would encourage you not to obsess too much over details that are related to imperfect proxies for bean mass temperature. Use the thermocouple and profiling data to aim for overall consistency. Use tactics and strategies to adapt the flavor of the coffee through roast manipulation into something you and your customers like, and then keep delivering that same great coffee. Use color measurement information, weight loss, solubility measurements and production cuppings to double-check yourself and stay consistent.

Know that everyone’s roaster, style, customer base and thermocouple is a little different. If something sounds off about the way someone is roasting, it likely has to do with these fundamental differences in how we view our roasting world. If you’re just starting, talk to the roaster manufacturer about how to use its machine and talk to other people who use that same roaster, but avoid obsessively comparing yourself to others. Sometimes something as simple as a different ventilation setup can cause your machine to roast differently and your thermocouples to skew slightly because of differences in airflow through the machine.
Finally, enjoy yourself, take chances, innovate, and relish the wonderful depth and complexity that exist within our industry. Treat coffee like jazz music. Learn the rules — or guidelines, as it may be — then don’t be afraid to bend and break them.
It is wise for roasters to continue to strive for consistency, and to do our best to understand what is happening inside the coffee roaster, but we must do so with both eyes open. At the end of the day, process temperature thermocouples are extremely helpful for consistency, but the data they report is not as accurate as many in our industry might believe.
Related Reading
Rob Hoos
Rob Hoos is director of coffee at Nossa Familia Coffee in Portland, Oregon. He is the author of Modulating the Flavor Profile of Coffee: One Roaster’s Manifesto and lead consultant for Rob Hoos Coffee Consulting (hoos.coffee). Hoos is a member of the Roasters Guild Executive Council; current chair of the Roasters Guild Education Committee; and a specialized lead instructor, subject matter expert and content contributor for the Specialty Coffee Association.